A Business Intelligence Solution for the biggest Tax player in America
Client
The Client is based in Seattle and is one of the biggest players in the financial sector. The firm is into Sales Tax Management and is a leading provider of cloud-based software platform that gives a variety of compliance solutions related to sales and other transactional taxes.
Industry
Financial Services
Business Challenge
We developed an online Ordering System that allows the dealers to place their orders online.The dealers can login to the system and place customized orders and get instant quotes 24/7. Once the dealer places his order the same gets assigned to the designated managers for approval. Post the manager’s approval the order goes to the production facility for completion of order. Some of the exclusive features of this Online Ordering System are as follows.
Below are the few Pain Points of the company:
- Customers information scattered over different System
- No Centralized Reporting System
Solution
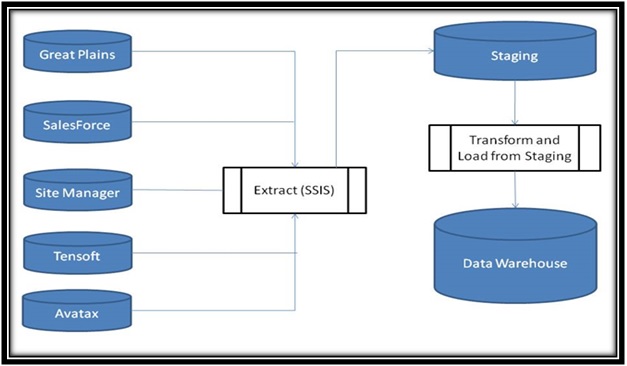
To address these challenges, we have provided them with a solution that extracts, cleans and unifies the data from all the different systems and brings it under one centralized location in the form of a Data-Warehouse. This consolidated data is used to generate reports for the decision makers (Managers and Top-Level executives) which enables them to analyze and plan the growth of the company.
Below Diagram shows the architecture of the system :
Benefits
The Client is not only able to get all their data stored and secured in one place but also to take business decisions intelligently by analyzing the data in the various dashboards. This has helped our client grow and become more productive.
Implementation of Technologies
We have made use of the extensive suite of Business Intelligence tools provided by Microsoft.
The SQL Server Integration Services (SSIS) from the MSBI stack has been used to provide a complete ETL solution for their data which gets stored in MS SQL Server Data-Warehouse in the form of Dimensions and Facts.
The warehouse data is then pulled into various Dashboards like Customer Satisfaction Index, Sales & Marketing. The feature-rich and flexible tool, Power Pivot based on Microsoft Excel and Data Visualization tool like Tableau has been used to create these dashboards for the Business users. The dashboards contain reports that provide a comprehensible view and the user can then choose to drill down along a particular dimension to see a more detailed view. The informative and creatively designed charts in the report help the user get an understanding of the data at a glance.
Sample Dashboards
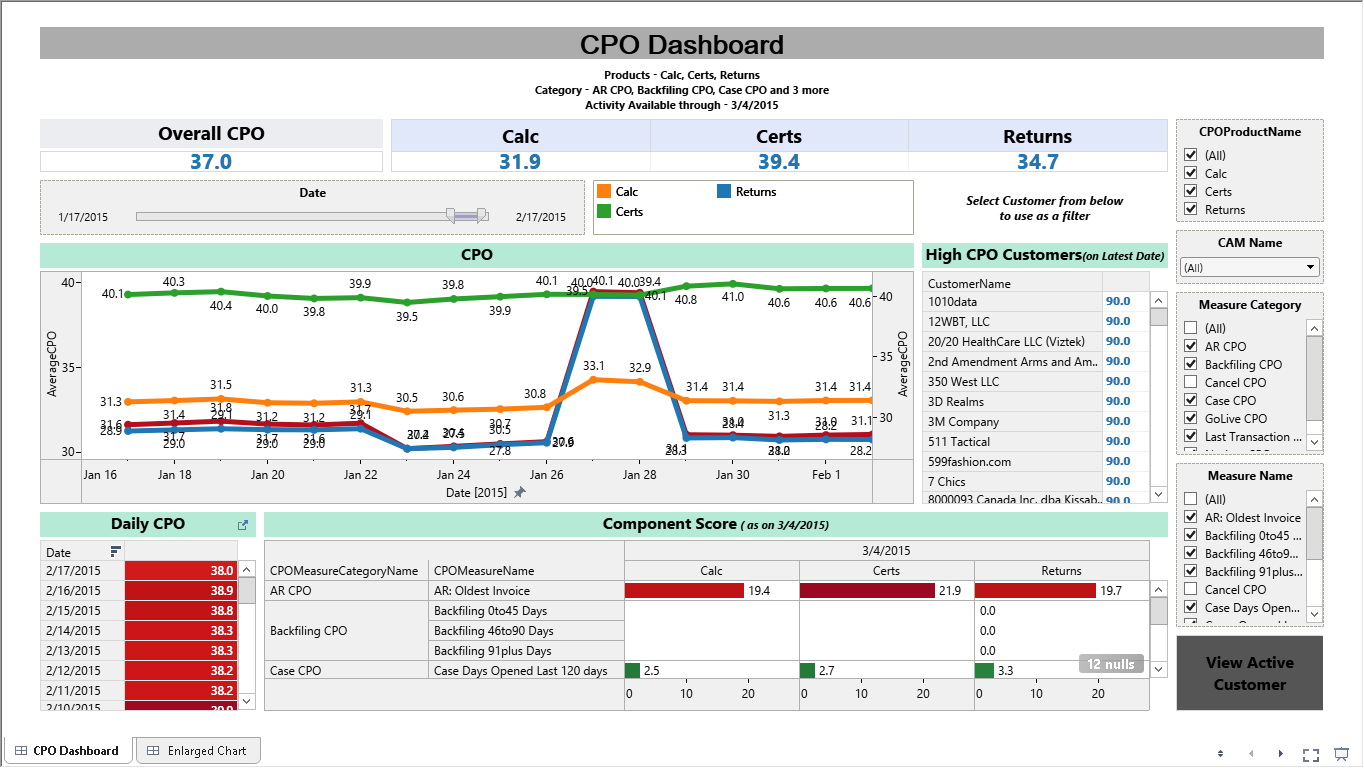
- CPO Dashboard:
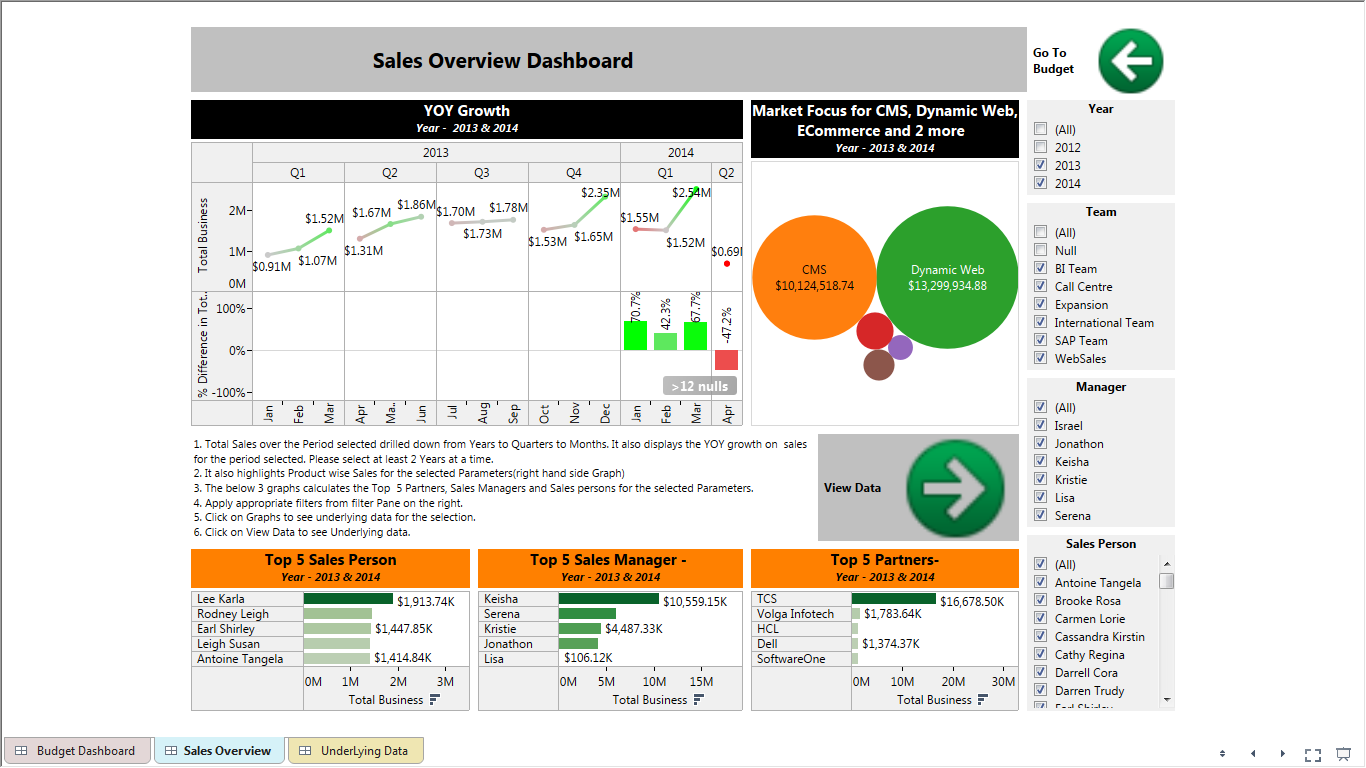
- Sales Overview Dashboard:
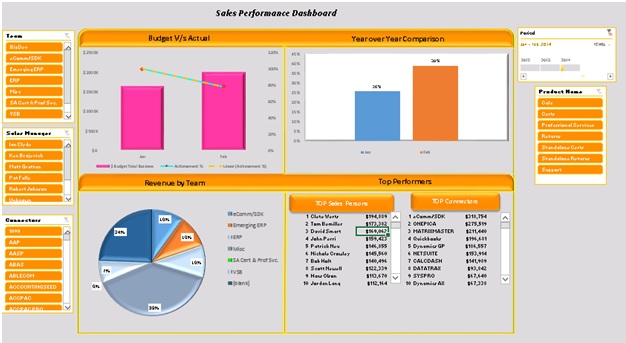
- Sales Dashboard:
- Velocity Dashboard :
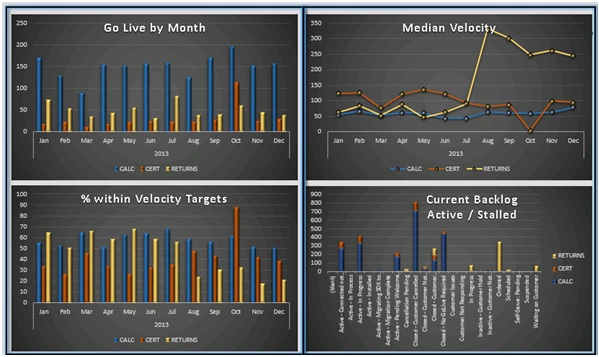
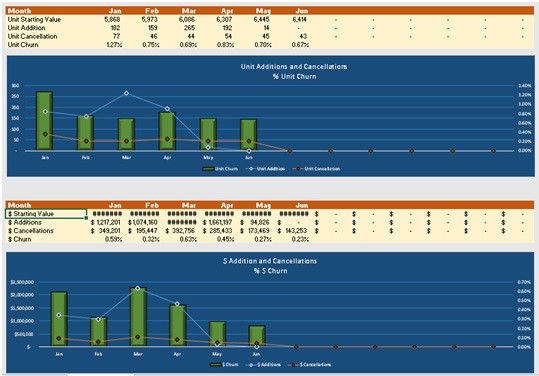
- Churn Dashboard :
Technology Used
| Operating System | Windows Server 2012 |
| Database | SQL Server 2012 |
| Development Tool | Visual Studio for Business Intelligence |
| Extraction Tool | SQL Server Integration Services |
| Reporting Tool | SQL Server Reporting Services, Power Pivot, Tableau |
| THIRD PARTY PLUGINS | ABF Services |
| Job Scheduling | SQL Server Job Agent |